MoonTides and Black Swans
|
Feb 5,2014 copyright 2014 Dr. Al Larson
After many years of study, research, and trading, I have decided to share one of my findings about a particular chaos cycle in the S&P. This is an energy cycle that is involved in nearly all of the BIG DAYS in the S&P, so it is worth knowing about. Unexpected events in markets are often called "Black Swans." They get their name from the fact that most swans are white. But there are black swans. I saw them in Australia. Black Swans appear in all freely traded markets, because these markets are provably chaotic. Chaotic markets are characterized by prices moving in relatively regular price ranges, interspersed with big moves well outside the normal statistical range. This behavior is not explained by traditional cycle models, which treat cycles as sinusoidal waves carrying price. What I have discovered is that Black Swan cycles streak through prices at regular intervals. But they may or may not "catch" prices and carry them along. When they do "catch", they produce big price moves. This is shown on the chart below.
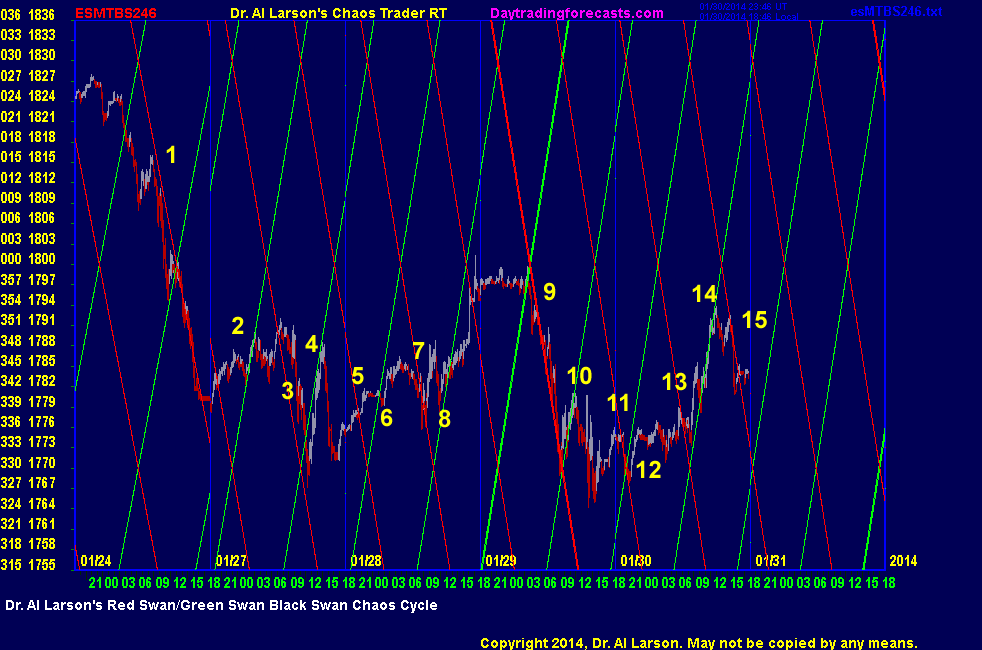
On this chart the Black Swan cycle is shown as Green Swans and Red Swans for the up and down phases of the cycle. The chart shows 6 days of 24 hour prices for the S&P eMini. At 1, prices were caught by the Red Swan on January 14, 2014. Midday there was a tiny rally due to the Green Swan, but then prices kept following the Red Swan down. This is a classic Red Swan BIG DAY. At 2 the Green Swan lifted prices briefly. At 3 prices declined parallel to, but no on, the Red Swan. At 4 the rally was due to the Green Swan again. At 5 the Red Swan had no effect at all, possibly due to the fact that it came in the overnight market. At 6 there was a weak delayed rally from the Green Swan. At 7 there was a brief drop on the Red Swan. At 8 the Green Swan produced a rally which carried prices higher. At 9 the Red Swan dropped prices sharply lower. Note that this red line is wider. It is the zero point of the Black Swan cycle. At 10, the Green Swan lifted prices. When the lift stopped, prices drifted until catching a Red Swan at 11, and a delayed Green Swan at 12. At 13, the Red Swan produced a brief drop, then the Green Swan produced a rally at 14, followed by a decline on the Red Swan at 15. From this it is clear that my Black Swan cycle does have a fairly strong effect on the S&P. While its effect varies in degree, it is clear that anyone trading the S&P should be aware of this cycle. This next chart shows more detail.
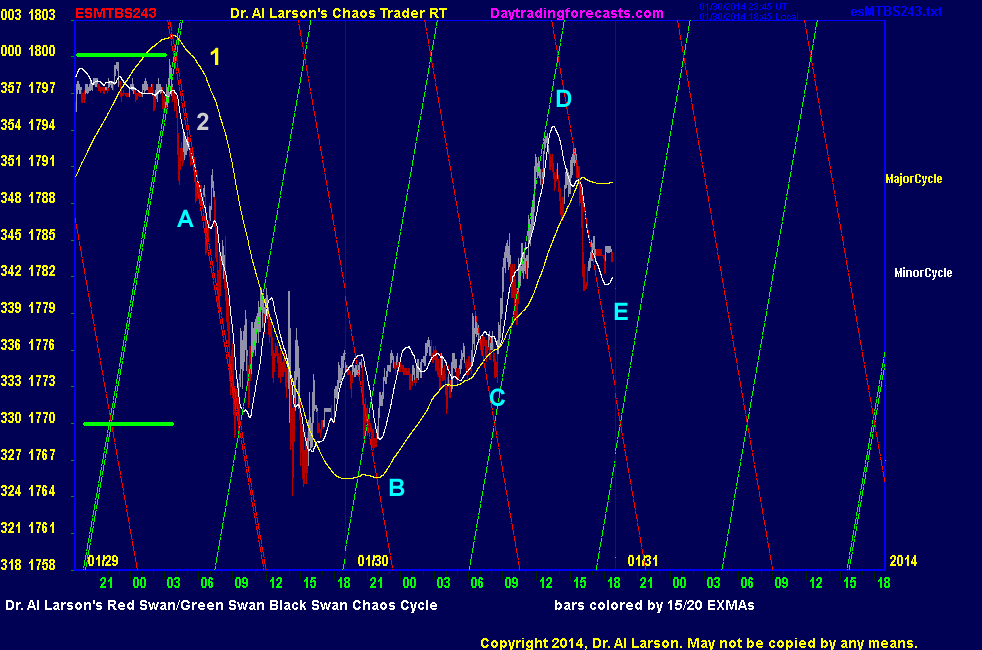
On this chart the Red Swan and Green Swan lines are over layed with two of my cycle filters shown by the yellow and white lines at 1 and 2. These cycle filters help me detect when the Swan cycles "catch." At A both cycle filters indicated that prices were captured by the Red Swan. When the white cycle turned up, the tracking ended, and a brief Green Swan rally followed. When prices "fell off" the Green Swan, prices drifted lower. At B, prices declined on the Red Swan, then rallied on a delayed Green Swan. This turned the yellow cycle up. This "Swan dip" was followed by another at C, at higher prices, The Green Swan "caught" and carried prices higher during the day session. Then late in the day the Red Swan caught prices at E, and prices gave up a good portion of their gains. Note that the Red Swan/Green crossovers are always potential turns. These crossovers occur every 30 points. This is part of the harmonic structure of the S&P, being 1/12th of 360. This fact by itselve can be a trading edge. Another useful observation is that tradable Black Swans often occur on alternate Red Swan or Green Swan lines. This is just a possibility, but one that can give you an advantage. You can be ready, then if the move starts on time, you can get in early. Use tracking indicators such as the 20, 110 and 440 minute EXMAs to confirm the move. Finally, the next chart is a one day chart which is the new Chaos Clinic chart on http://daytradingforecasts.com. Since my Black Swan cycle is so important, I have added it to the chart, along with the MoonTides.
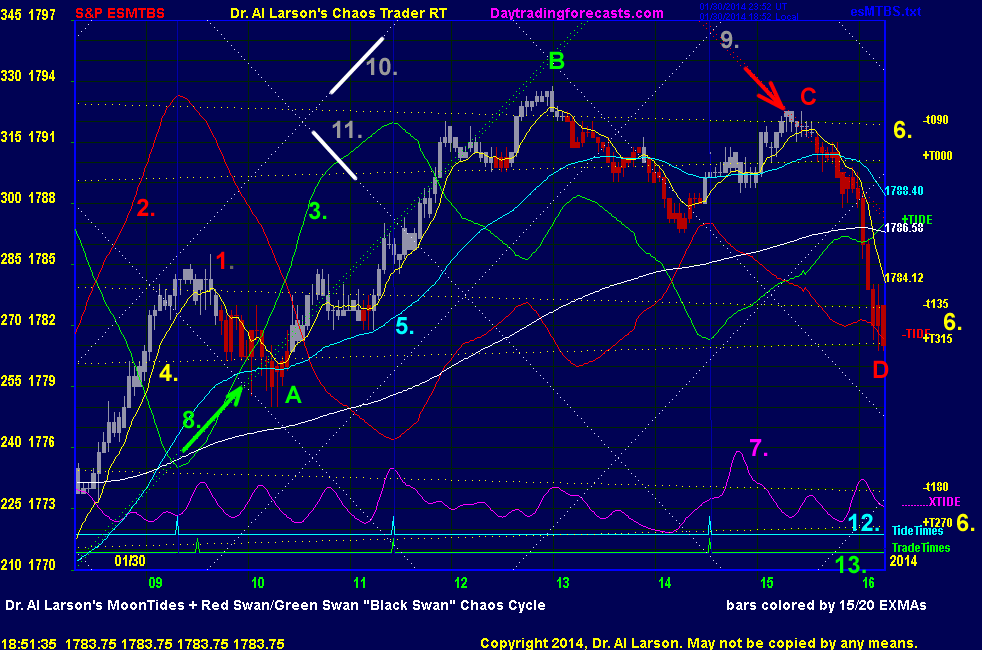
This chart shows prices as 3 minute candlesticks (1) colored red and gray by the crossings of the 15 minute and 20 minute EXMAs. My software allows computation of EXMAs on one minute data, independent of the price bar setting. Time is shown in Eastern time, whether standard or daylight. the Moontides are shown as green (3) and red (2) lines. These energy forecasts are arbitrarily scaled, so only give estimates of the price move. Turns in the MoonTides are shown as pippers at 12. My software heuristically selects some of these turns as Trade Times shown by the pipper line at 13. The yellow 20 minute EXMA (4) and 110 minute EXMA (5) are used as aids for trading the Moontides. See the tutorial on this at http://daytradingforecasts.com/ttsec.asp (separate window/tab) The yellow lines at 6 are the electric field flux lines of generated by the Moon. These occur in positive and negative pairs at 45 degree intervals. These act as support and resistance to price moves. Their behavior over time creates a 9 point quantum effect in S&P prices. Besides the MoonTides, another forecast called XTide ( do not confuse with XTide2Plus ) is shown in magenta at 7. This tends to be an "efficiency of movement" forecast. For example, The higher upward surge just after 11:00 forecast the rally to the highs. In addition to these lines, there are two sets of diagonal lines at 8, and 9. The green lines are the Green Swan lines as per the previous discussion. The red lines are the Red Swans. The white diagonal lines at 10 and 11 are minor Black Swan lines. Often when a move occurs off a Red or Green Swan line, it will occur along one of these lines. These secondary harmonics account for most of the "delayed" moves observed earlier. On this day, January 30, 2014 the first trade time was at 9:31. Near that time the 20 minute EXMA turned down while the 110 was up. Prices sagged into a continuation buy setup at A. This possibility was forewarned by the Green Swan line at 8. The Green Swan seemed to catch as the Green Swan crossed the Moon +T315 electric field flux line. A pause occurred at the -t315 flux, then prices rose to follow the Green Swan. up to point B. At that point a pullback developed roughly along the downward white minor swan. Prices then turned back up at the Tide time near 14:36. Prices rallied a bit up to the -t090 Moon flux. When the Red Swan crossed this flux, prices started down along the Red Swan, before dropping a 9 point quantum in the final 15 minutes. Note this move was forecast by XTide.
Black Swans are supposedly unpredictable events. My work shows that this is not true. While prediction that they absolutely will occur is probably not possible, it is possible to predict the energy flows that can produce Black Swans. It is then possible to determine when a Black Swan has "caught" the market, and to profit from that knowledge. To avail yourself of this discovery, just sign up for Tomorrow's Market email at http://moneytide.com. This will give you daily access to http://daytradingforecasts.com. where you can see these charts in action. [ Home ] [ ListOfCharts ] [ Chaos Clinic ] [ SPKISS ] [ Wheel ] [ SP1Day ] [ SPBias ] [ XTide2Plus ] [ MTRainbow ] [ SPSunMoon ] [ Aspects ] [ Aux ] [ Alert ] [ Chat ] |