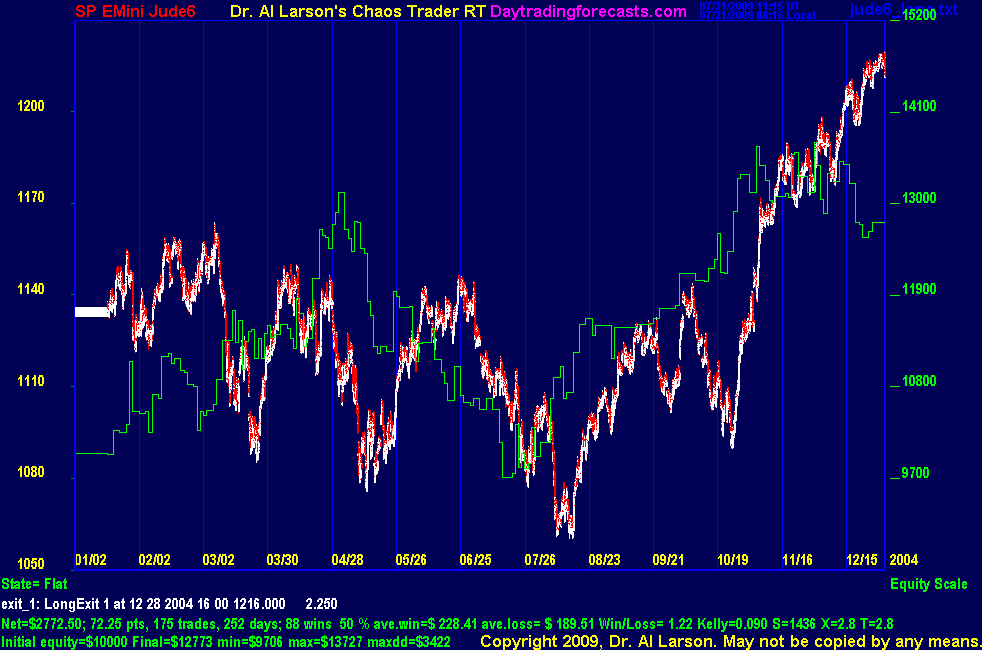
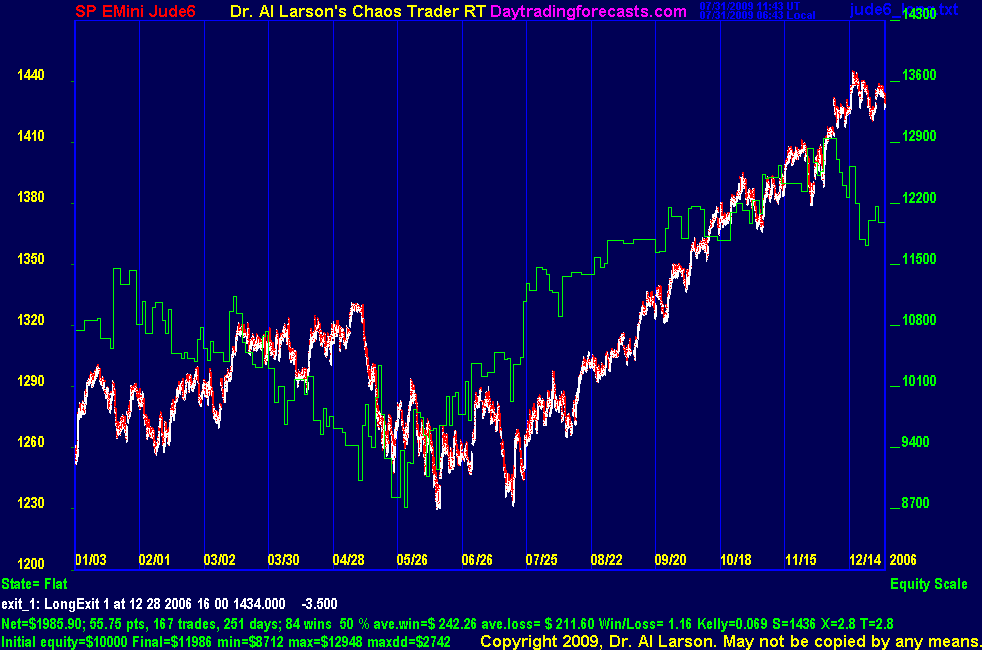
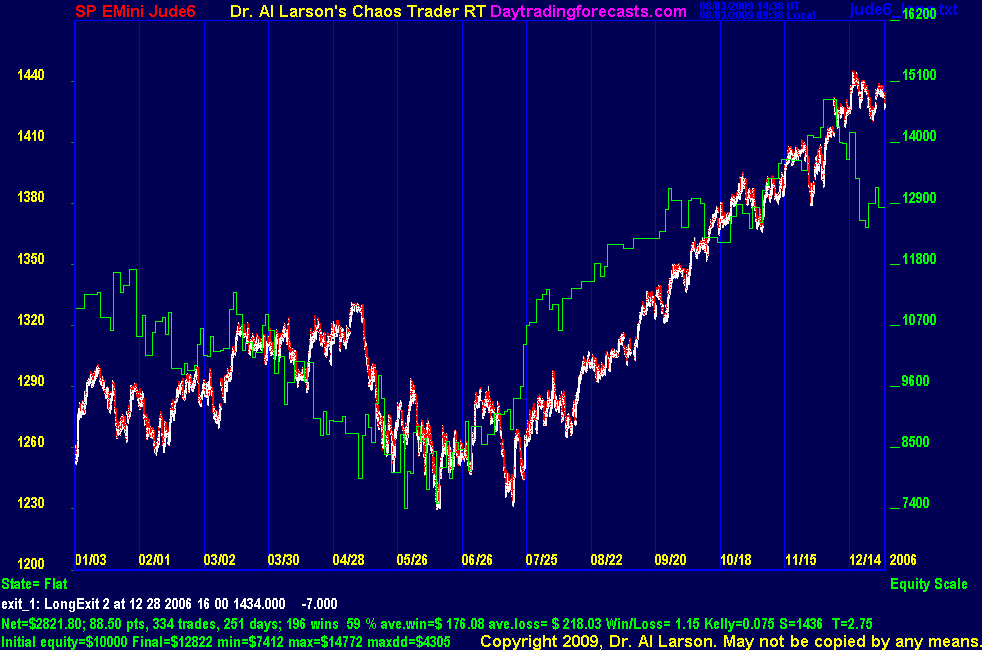
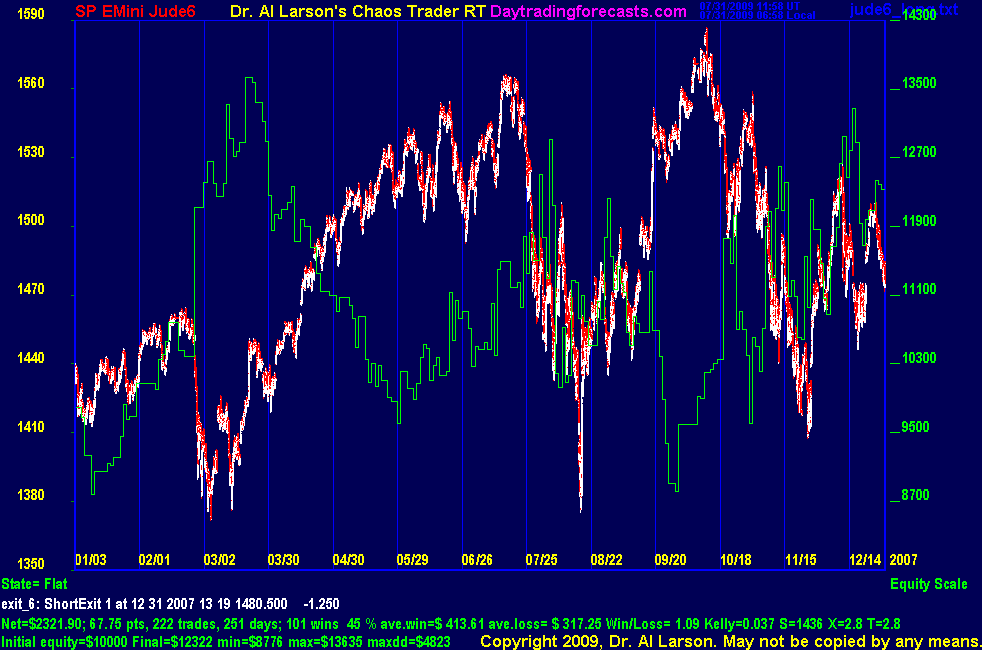
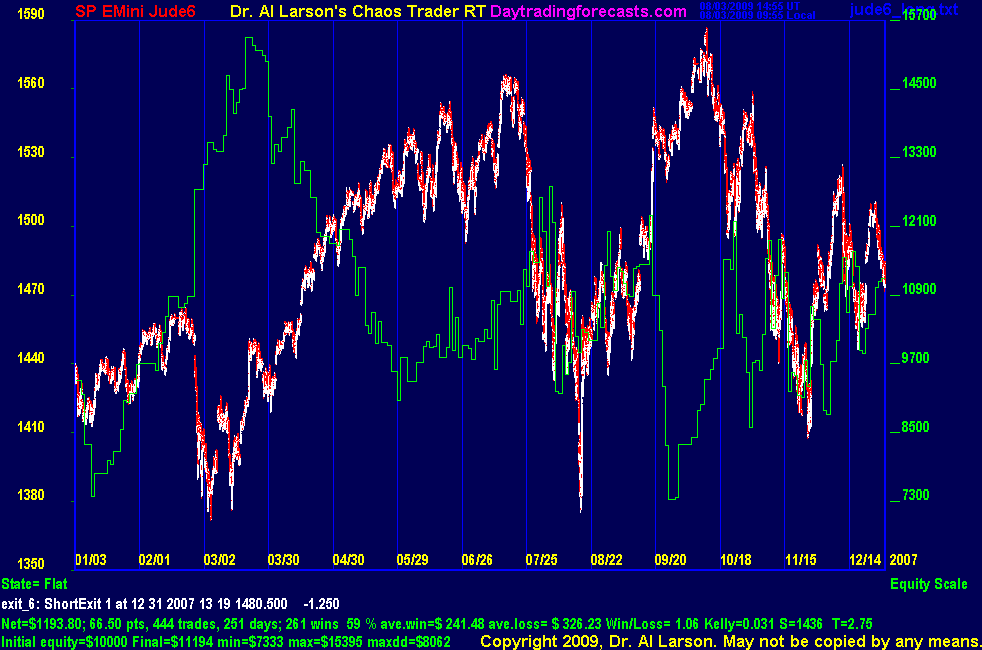
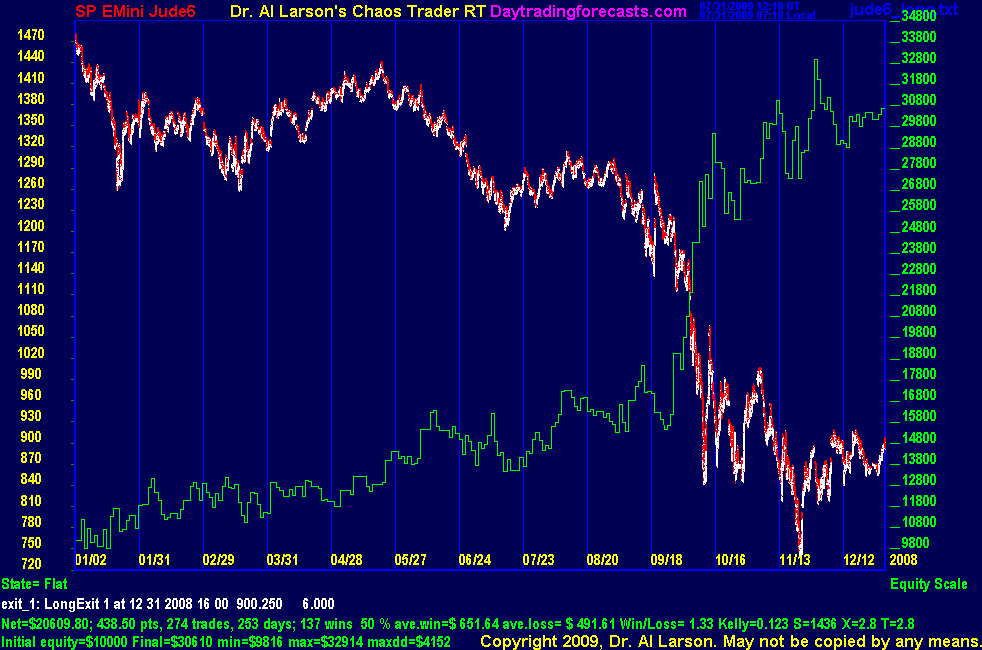
Money ManagementAugust 6, 2009 Last week during the Chaos Clinic, I was asked to comment on money management techniques. A common technique used for money management is to trade multiple contracts, taking a small gain on half the contracts, and holding the other half for maximum gain. Does this really buy you anything? I have not added such a rule to the hotline standing rules. So why not? The answer is simple-it hurts profits. But there is a benefit of using this technique. A proper analysis can be done only with a thorough simulation of the technique. To illustrate this, here is a study of the technique applied to my Jude 6* autotrader. I use this, because Jude 6 is a totally automated system, whereas the hotline trades are not 100 per cent mechanical. But the effect of the money management technique is applicable to any system. In the charts below, each covers one year. First is the chart for trading one contract for maximum gain, and the second chart shows trading two contracts, taking a quick gain of 2.75 points, and letting the second contract run for maximum gain. At the bottom of each chart is shown the resulting statistics. To compare the two charts, one needs to double the numbers for one contract to get the numbers for two contacts. The green scale on the right is the equity curve scale. Equity is plotted in green. Besides the amount earned, one needs to watch the per cent wins, the average gain, average loss, and the maximum drawdown. The maximum drawdown (maxdd) is the maximum decline in the equity curve. This gives a measure of the worst case scenario if one started trading the system at the worst possible time during the sample period. I also like to watch the Kelly factor, which is a measure of robustness of the system. It gives the percentage of your bank roll that you should bet if you want to maximize the growth of your equity curve by adding contracts as the system builds equity. A Kelly factor of .25 would say to bet 25 % of your equity on each new trade. The higher the Kelly factor, the more you can leverage the system. This leverage is NOT INCLUCED in the charts below. Here is how the Trade Two For All and the Trade Two, Take One Quick money management techniques compare. Past year trading one contract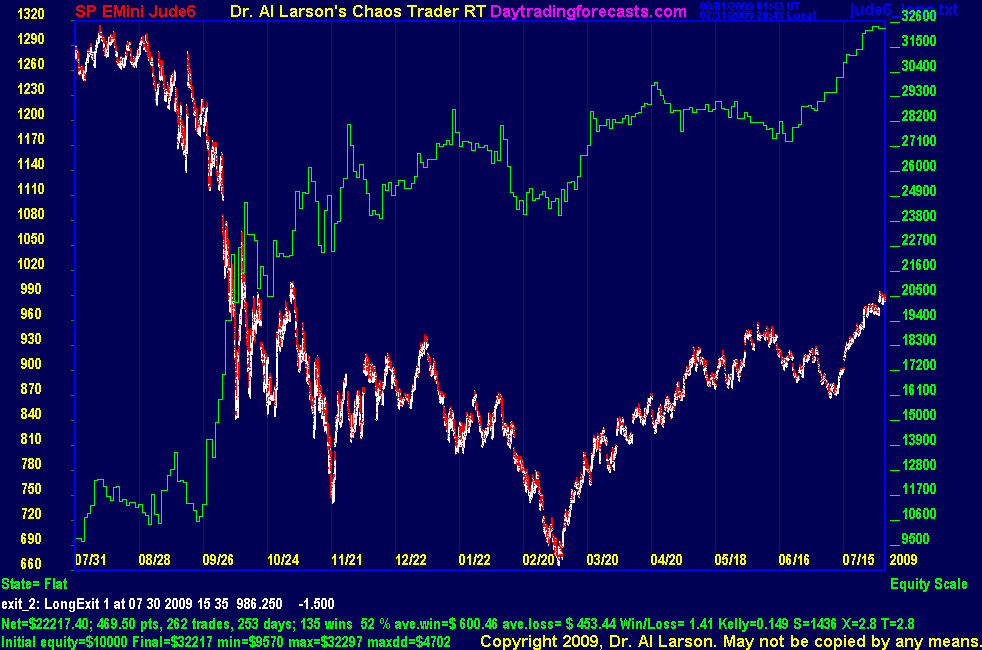
If this method traded 2 contracts, the numbers would double to
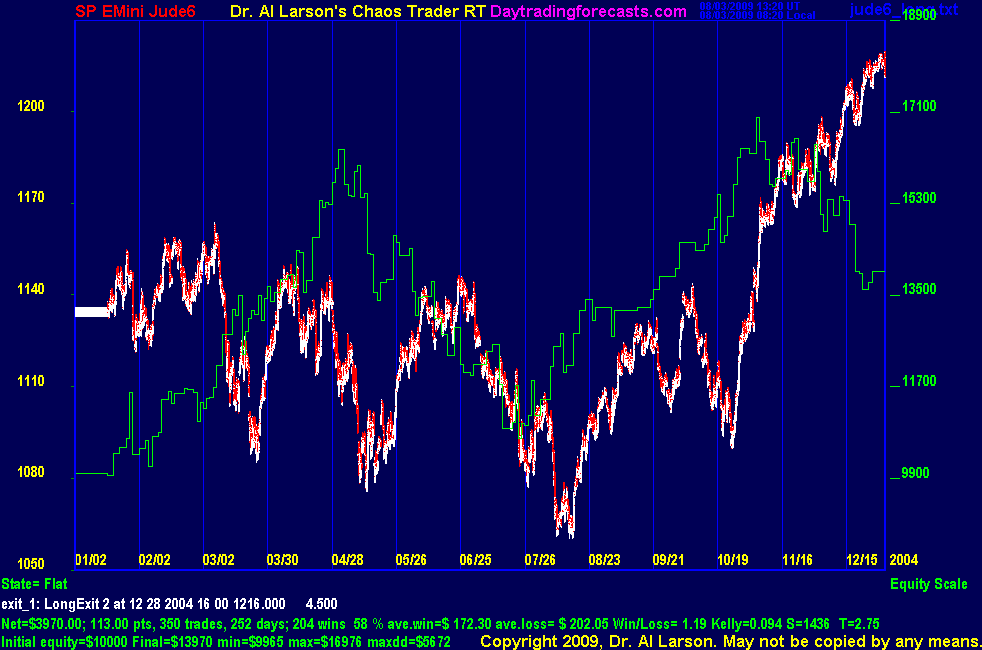
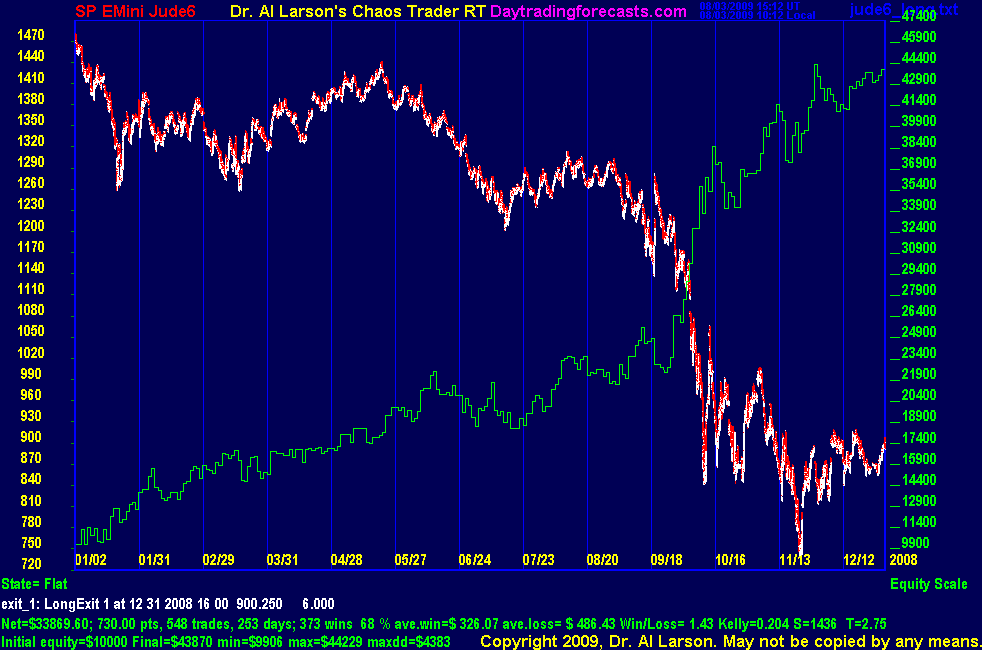
Past year trading 2 Contracts, taking one quickly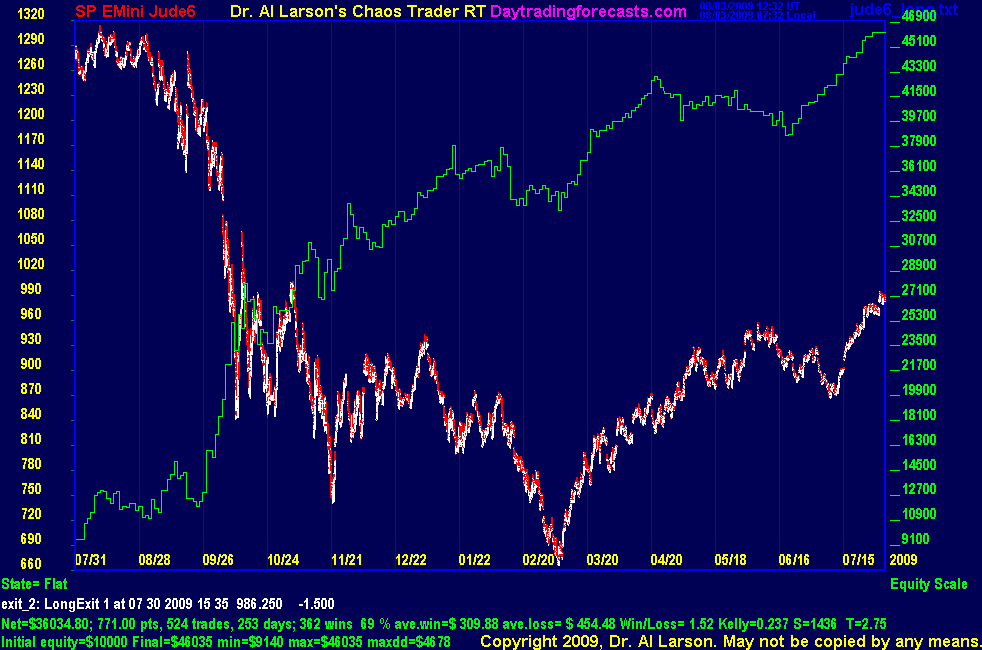
The result of the Take One Quickly strategy is that it smoothes the equity curve; increases the per cent wins, Win/Loss, and the Kelly factor. These benefits come at a total profit cost of $8399. To further evaluate the Take One Quick strategy, let's look at 5 years of backtesting. Five years of historical backtesting2004
Above is two contracts, with Take One Quick strategy.
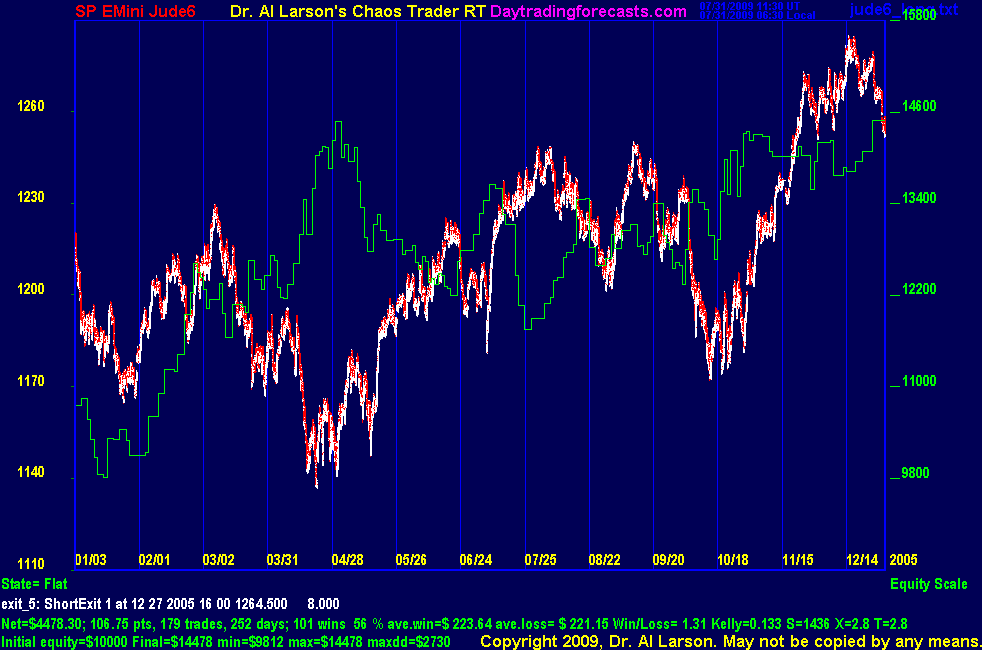
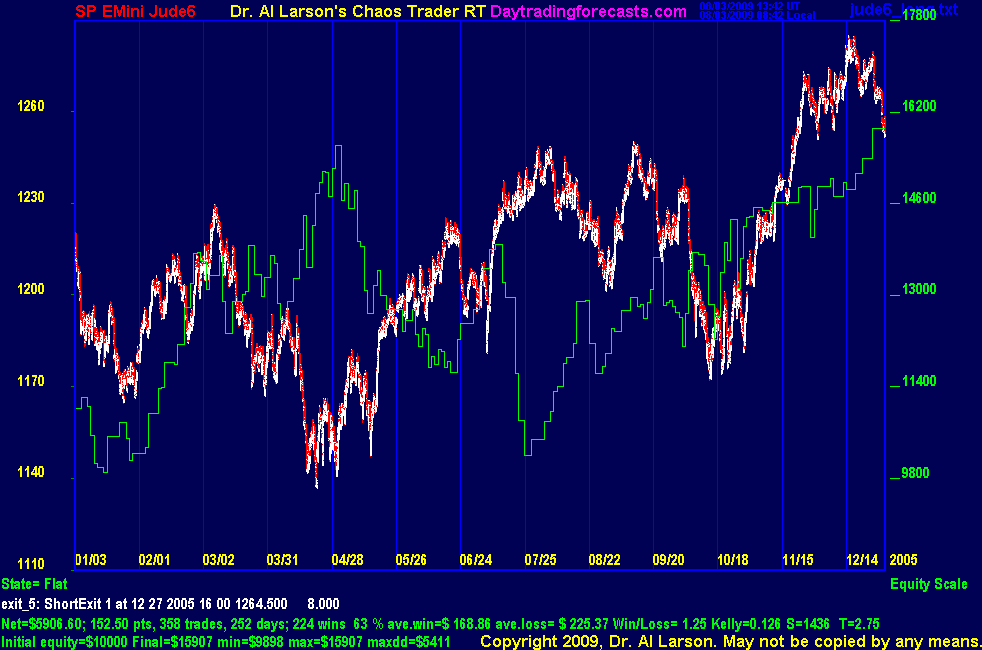
2005
Above is two contracts, with Take One Quick strategy.
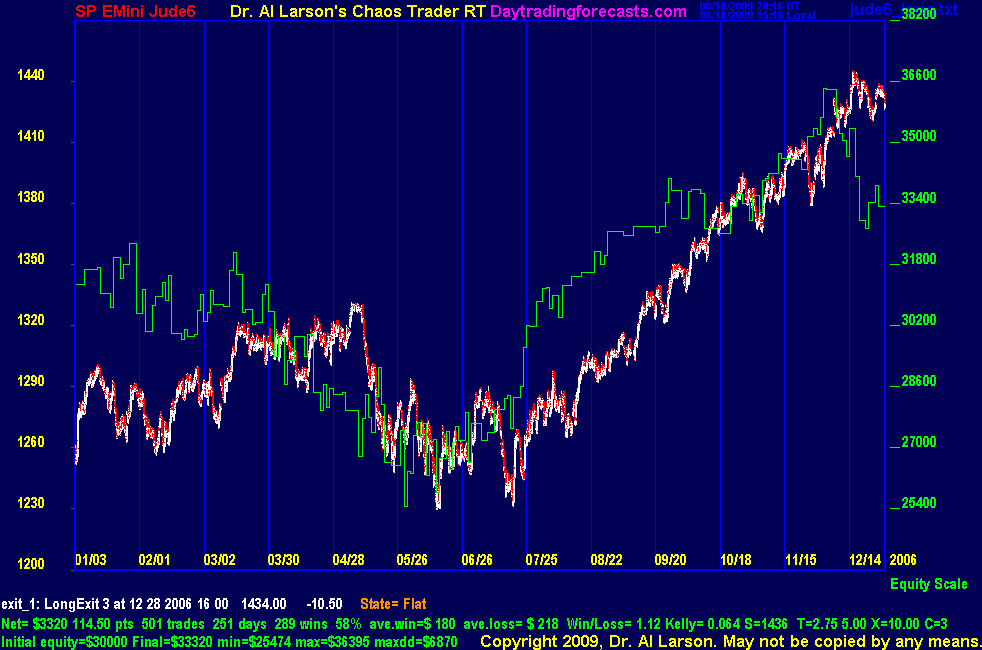
2006
Above is two contracts, with Take One Quick strategy.
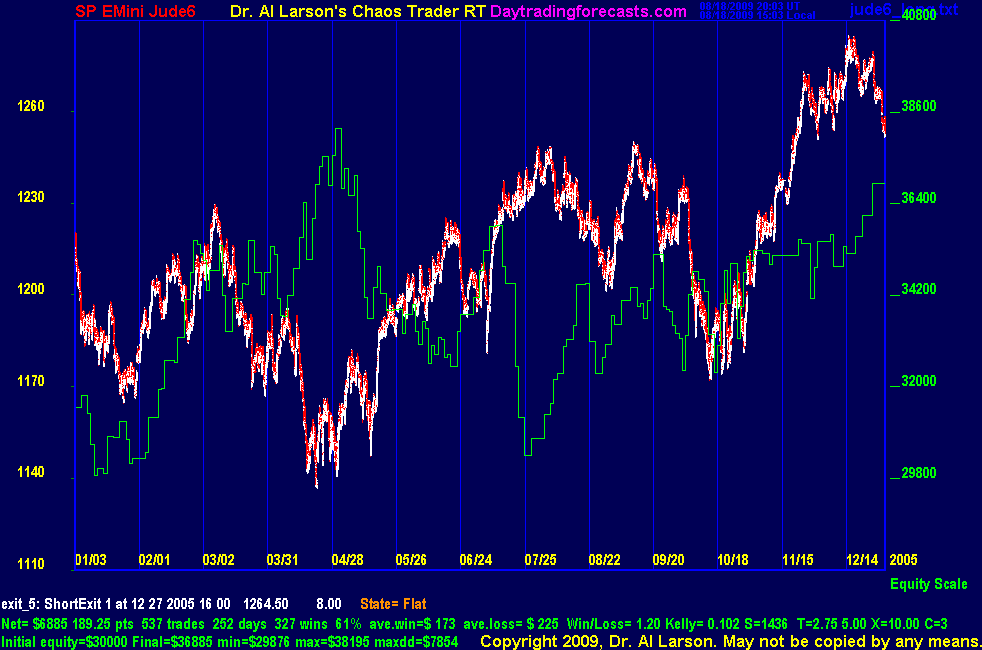
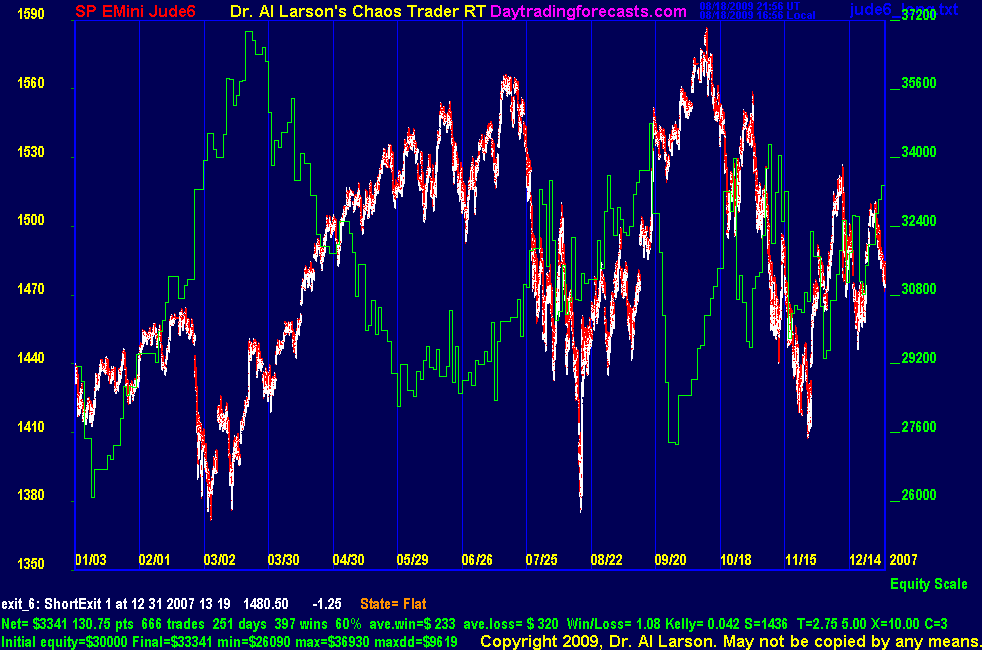
2007
Above is one contract. Two contract net = $4644, maxdd = $9646.
Above is two contracts, with Take One Quick strategy.
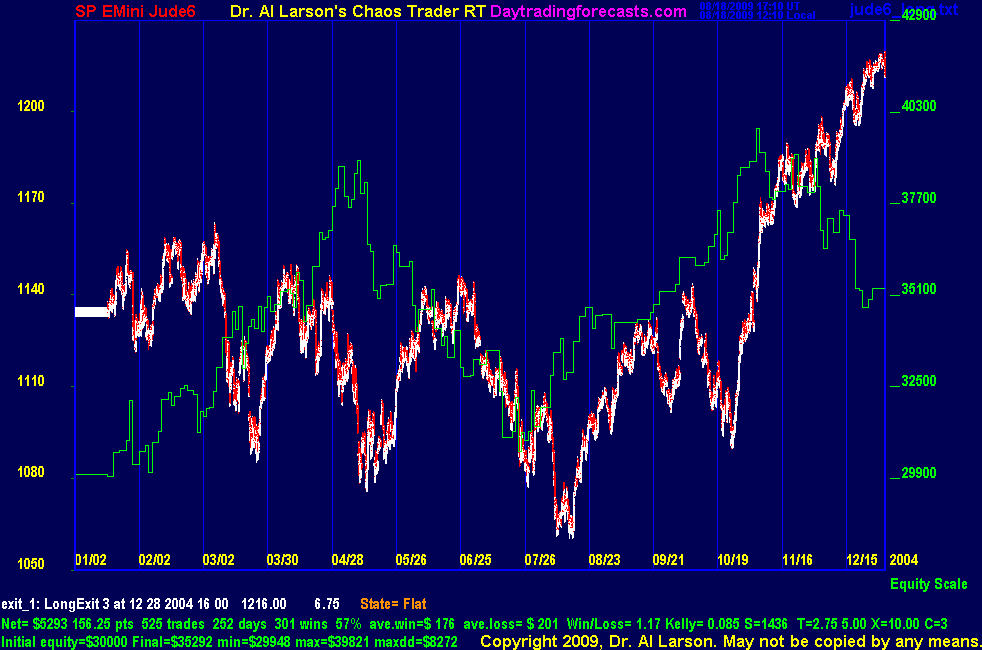
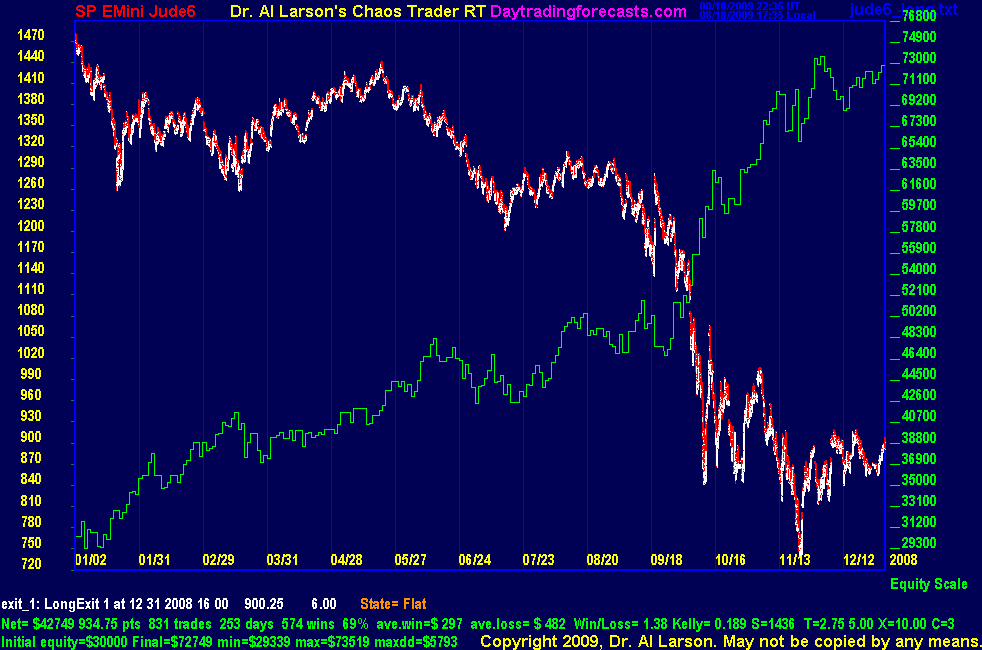
2008
Above is one contract. Two contract net = $41220, maxdd = $8304
Above is two contracts, with Take One Quick strategy.
Trading Three ContractsAnother common money management technique is to trade 3 contracts, taking a small, medium, and (hopefully) big profit. Here are 5 years of historical test results for Jude 3 using this money management method. Initial equity has been set to $30,000 and a secondary stop has been introduced to limit the damage of trades when all three contracts are losers.
2004
2005
2006
2007
2008
ConclusionThe best way to compare the money management techniques is by looking at the percentage gains and drawdowns. What gain are you giving up to reduce your drawdown? This table shows the result of this Jude 6 study. It assumes an initial equity of $10,000 per contract.
The conclusion is that not going for maximum on all the contracts costs you profits. But it does reduce drawdown and smooth the equity curve. So it is a trade off. It does help with the psychological battle of trading, and it can keep a small trader in the game by reducing drawdown, thereby reducing the possibility of being taken out of the game. * Jude 6 is a "work in progress" trading system under development as of the date of this writing. It is based on tools taught in the Chaos Trading Made Easy course. |