Today's 1ADay trade was to go with the flow coming out of the 10:15 MoonTide turn. The entry technique suggested was to look at the 3 point quantum ( a price evenly divisible by 3) near 10:15, place a buy stop 1 quantum above, and a sell stop one quantum below. The goal was to claim 12 points if a really fast drop occurred, or 6 points if it did not. The time stop was to exit at 12:20 if still in.
Another possibility suggested was to go with the flow at 1:45.
Here is the SP1day chart.
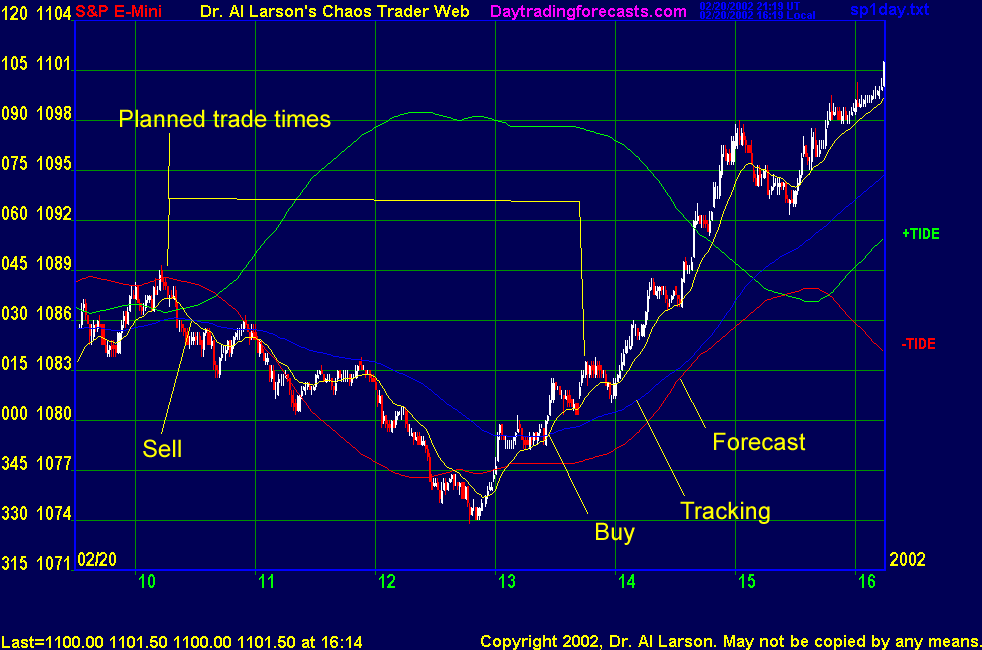
Notice the blue 110 minute EXMA, and the red -MoonTide. That's a pretty splendid forecast. Then notice the yellow 20 minute EXMA. It crossed the blue 110 at 10:30, giving a sell signal, with price at 1084.50. Then it gave a buy at 1:30, near 1081. So the two tracking indicators confirmed the two tradable turns in the MoonTide forecast.
And the afternoon rally stayed above the 110 EXMA into the close. So it was a great combination of a forecast, and the two tracking indicators making trading both easy and profitable.
The 1ADay had a quantum price of 1089, putting the sell stop at 1086, which was hit. The trailing stop was 1089, moving down 1 point every 30 minutes. Just before the 12:20 timeout, price hit 1080, for a 6 point gain.
Again, a good forecast, good planning, and good tracking made for good trading. Love them MoonTides.
|
[ MoonTide Tutorial ] |
[ Home ] [ ListOfCharts ] [ Chaos Clinic ] [ SPKISS ] [ Wheel ] [ SP1Day ] [ SPBias ] [ XTide2Plus ] [ MTRainbow ] [ SPSunMoon ] [ Aspects ] [ Aux ] [ Alert ] [ Chat ]