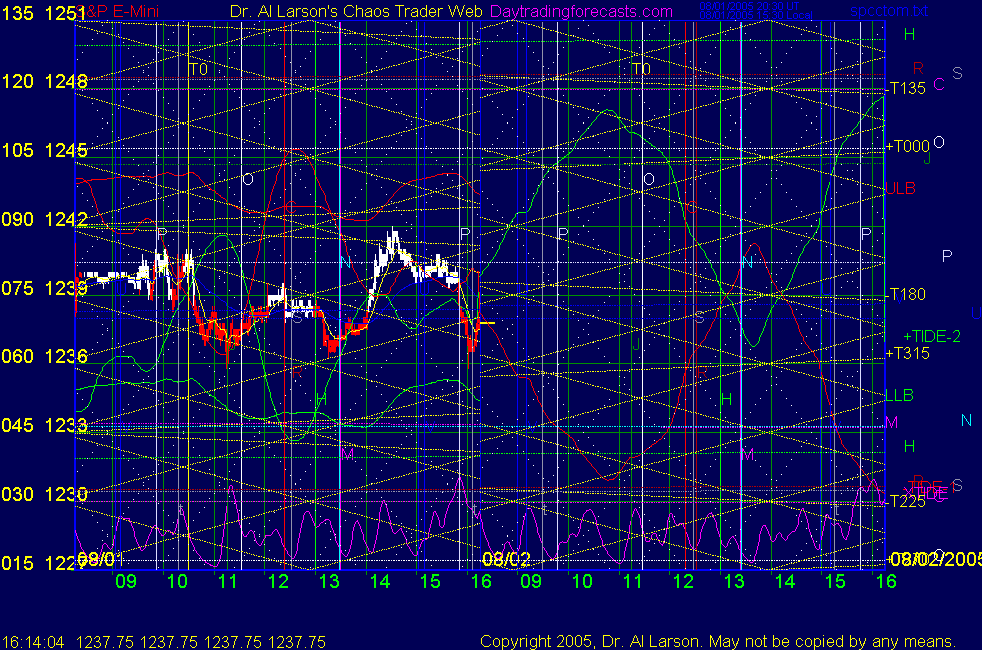
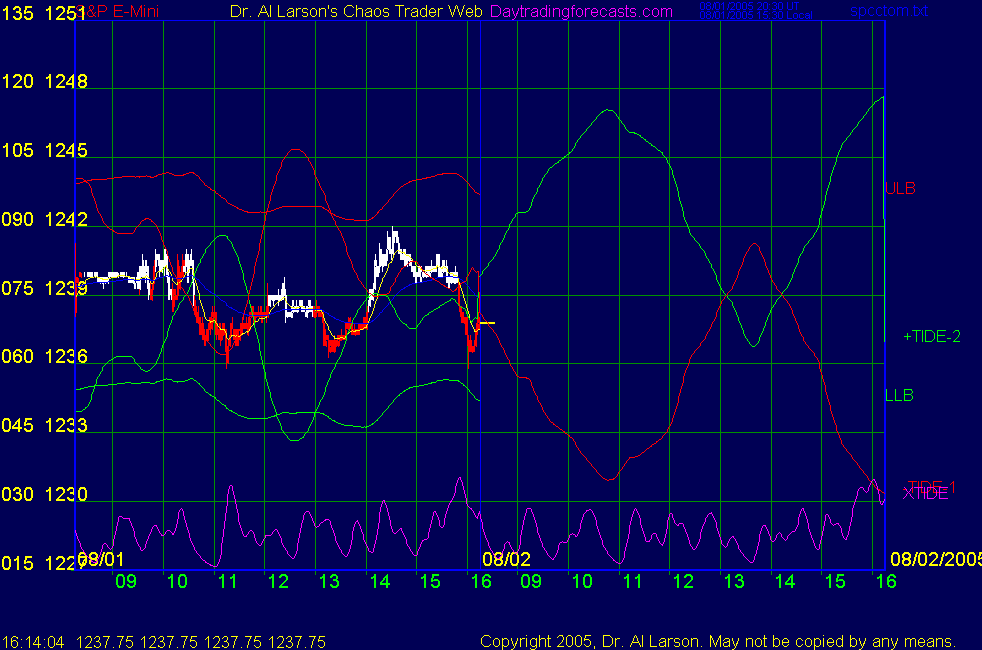
all times given are Eastern Today: Sun/Chiron/Saturn/Mars: 1248-high Uranus: 1238 -low Win2Day: +5 pass,pass as I did it last trade was there but I was out of gas Tomorrow: ************************ I really don't know what to make of it, XTide2 being new and experimental; but it is showing a big move early in the day, running 8:30 to 9:20 if no time shift, 9:30 to 10:20 with a one hour shift. Today was a 1 hour shift.The Moon T0 timeline is near 10:25, on a MoonTide Harmonic grid crossing, which suggests a high energy point. That big move ends in a spike reversal and a 4.5 hour move the other way. This would fit with an inversion of the MoonTides near 12:20 This is just research in progress, and may be baloney, but watch your indicators and be alert Tide Times:
Prices: all +/- multiples of 18 points
Remember, *********** chaos follows dullness !!!!!!!!!!
----------------------------------------------------- For trade times before 11:00, be sure to use EXMA's that include data from 8:15 Eastern Normal Rules ( as published on daytrading forecasts.com in the tutorial): These fit a Trend or Trend continuation scenario, identified by prices trading within a couple of points of the 110 minute EXMA, taking profits on a 12 point range. 1. Watch for the opportunity to go with the trend or change in trend at the time(s) given. Be alert for the turn coming early or late. Be patient and use the tracking indicators. Plan to trade in the direction of the 110 EXMA coming out of that time frame. Prices should stay on one side of the 110 EXMA and it should be moving, or curl up or down from a flat position. Prices should be within about 2 points of the 110 EXMA. The 20 minute EXMA should have crossed the 110 EXMA, or dipped toward it and then pulled away from it. When this setup is clear, enter in the direction of the 110 EXMA with a 3 point stop. If each setup is not clear 60 minutes after the given time, skip the trade. 2. Move the stop 1 point each 30 minutes. If market moves decently, trail it by 3 points. 3. Cover on a 5 point gain**, 90 minutes after entry , at the next Tide turn , or if the prices clearly recross the 110 minute EXMA. ** see fast move rule and stall rule ********************************************************************** Band Edge Rules: These fit a trading range scenario, identified by prices 4.5 points or more from the 110 minute EXMA 1. If prices trade to or outside a band edge, and the 3 minute candlesticks form a Shooting Star (SS), or a Hammer (H), near the Tide Turn, the trade is setup 2. Enter when price breaks the 20 minute EXMA moving toward the 110 EXMA. 3. Trail an exit stop 2 points from the 20 EXMA 4. Cover on a 4** point gain ** see fast move rule and stall rule **FAST MOVE RULE If the trade gains 3 points within 30 minutes of entry, press the stop, using the 20 EXMA as a guide to move the stop to the low or high of each pullback (normally about 15 minutes long) once the move makes a new high or low. Cover any gain of 9* points. *It is OK to use the fast stop rule if a trade starts fast, but to then cover at +5 or +4 if it slows or stalls
***Stall rule: |