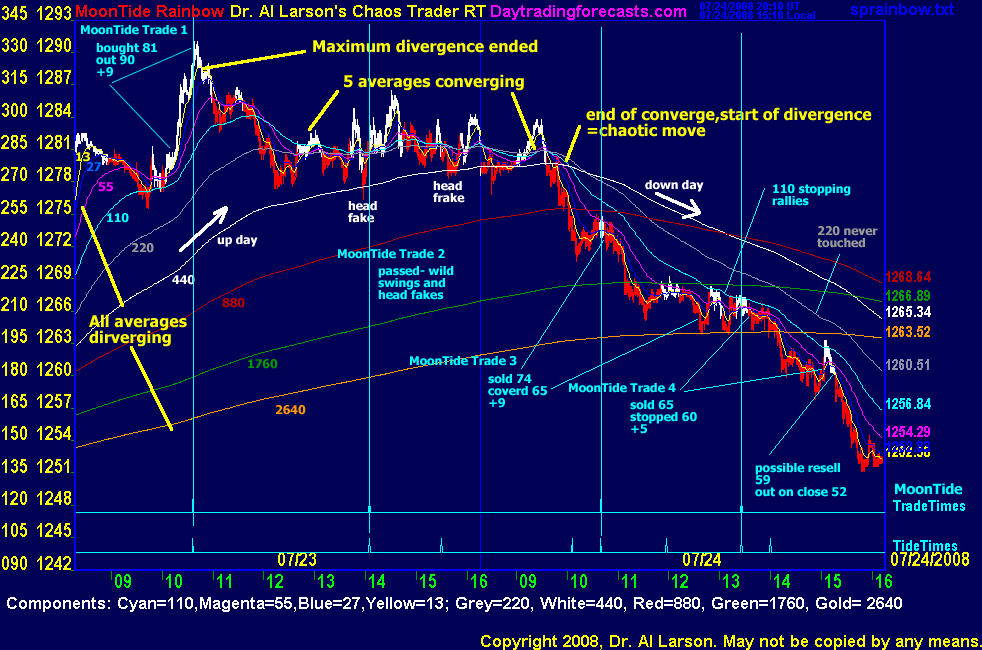
Trading the MoonTide RainbowJuly 24, 2008 God* has favored me with many blessings. This week He favored me with yet another insight-the exact time and price of the recent up fractal. This new insight, I was told, was not to be shared with the public. But I was told to share this page, as a passing on of my blessings to you. One of the charts I find very useful for judging the mood of the market is my MoonTide Rainbow chart. This chart displays a rainbow of moving averages that are tuned to the Moon's motion. The tuning starts with the 110 minute EXMA. A few students have teased out of me the fact that this sacred number is one degree of Moon motion. What I really like about this chart is that it lets me see the big picture, as opposed to just watching the events of the last 20 or 30 minutes. So it provides a trading context. From the 110 EXMA, additional moving averages are added by doubling and halving. There are two reasons for this. First, doubling and having is the basis of octaves in music. So this represents the harmonic nature of the energy being tracked. Second, in chaos theory , frequency doubling or halving is a precursor to chaos. So the rainbow helps pick up these shifts from a stable to a chaotic state. Gerald Appel picked up on this when he invented MACD - moving average converge divergence. And a rainbow of averages technique was published years ago in Stocks and Commodities. What is different here is using 8 octaves of averages, all tuned to Moon Harmonics. This chart shows the MoonTide Rainbow for July 23-24,2008. The rainbow lines are Cyan=110 minute EXMA=1 degree Moon motion, Magenta=55=1/2 degree, Blue=27=1/4 degree, Yellow=13=1/8th degree; Grey=220=2 degrees, White=440=4 degrees, Red=880=8 degrees, Green=1760=16 degrees , and Gold= 2640=24 degrees. The last one is not in the binary sequence, but is three times the 880. This is just an addition average that I have found useful. The white 440 is about 1/4th a day in time, or about the length of the trading day. So it tracks the trend of the day. Its slope is a good indicator of the emotional bias of the day. The 880 tracks the two trading day trend, and the 1760 the four day trend. The 1 minute bars are colored red or white, as the 13 and 27 minute averages cross. This is useful for finding entry and exit points. They should be taken as entries only in the direction indicated by the 110 and 220 averages. The chart I use is a two day chart, including the NYSE outcry session from 9:30 to 4:15 Eastern, and 1:15 before the outcry session- i.e., from 8:15-4:15 Eastern. This surgically tunes the chart to the 8 hour period ( third harmonic of the day) in which the most volume occurs.
The basic use of the rainbow is to pick up periods of maximum divergence, when all the averages are far apart (point A on the chart); and convergence, when several of the averages cluster together (point B on the chart). At the end of such clustering, a harmonic shift occurs (point C on the chart), creating separation in the averages, as a chaotic move develops.
This chart is helpful for trading the MoonTide turns. Some possible trades are annotated on the chart. For entries on this chart, I watch the for the 13 minute EXMA crossing the 27 minute EXMA, and the 27 minute EXMA crossing the 55, since there is no 20 minute average in this scheme. This chart can be created in nearly any trading software (except maybe for coloring the bars). If you watch it over time, it will help you get a feel for how constipated or flowing the market energy is. Watch how the averages progressively roll over, and how the congestions come when 5 or more of the averages intertwine. Note how the 220 and 440 stop short term moves (20/110 crossings), turning them into head fakes. Notice which averages straighten out - these are the strongest. Notice how the longer averages change slope near the middle of a move. Notice which averages are stopping the minor moves. Notice which average is not being touched-it can be used as a stop. Notice how congestions of the shorter averages form near the longer ones. Notice how the 110 crossing of each longer average continues the move on a run away day. Notice how the family of averages can be used to trade multiple contracts. I can't give you all the rules, but you can figure them out. Study, study, study. It will pay off. Learn to go with the flow, and stay out of the congestions. This chart also works well with the Hannula Market Fractal, Fractal of Pi, Face of God, and Fractal Grid tools from my Certified Chaos Trader courses.
Enjoy,
* I've known for some time that all my insights come from some higher power- call it God, the Great Engineer, the Great Spirit, Source, or whatever. To me, God IS the universe - the total of all the energy of the universe. We are all part of that energy field, so there is a part of God within us. I believe that this universal energy flows through all of us, and that if we tune in to it, good things come our way. This belief has been the root of my spiritual quest. As a trader, I finally realized that having that part of God within me as a trading partner was very important. One has to believe that God wants you to prosper, and that He will help you. Recently, I was led to someone who elegantly expresses that same belief - Joel Osteen, a preacher in Texas. I find his words of inspiration very useful to me as a trader. You might want to check him out at JoelOsteen.com copyright 2008, Dr. Al Larson http://moneytide.com |