Pivots and Planets at Daytradingforecasts.com
a division of MoneyTide.com|
February 11, 2004 I recently automated the calculation of pivot prices, as advocated for some time by 12 year client MM. I also have, for the past 6 or 7 months, posted "hot" planetary prices. When these are combined with the Tide turns, and standard technical indicators, some good trade setups are quite easy to see. The purpose of this page is to describe a simple way to combine these approaches. Before I begin, let me say that the pivot calculations I use come from client MM, although I had a simpler form of them. While there are a variety of formulas for pivot price calculations, there are some common formulas. The pivot point, for example, is always the arithmetic average of the prior day's high, low, and close. A normal set of pivot calculations gives a pivot point, a couple of resistance points, and a couple of support points. There is a question of what session to use for the prices in the calculation. The ones we use, which work well, are the 24 hour all session prices, captured at the close of the outcry trading session. These prices are posted on the SP1Day page each day, if the technocrap works right. Pivot calculations have been around for a long time. Even W. D. Gann used them. Interestingly, he also used them on planetary prices to help him find key support and resistance levels. My friend MM argues that the S&P pivot prices are important because the pit watches them. My view is that the prior day's high, low, and close were formed by the combination of many energy fields, and that the pivot calculations are important because they tell us something about the fields for the next day. In my MoonTide work I have found that there is a 1 day delay from the calculated MoonTides until they show up in the markets, so calculating the pivots with a one day delay is consistent with my research. The problem I have always had with the pivots is that they are frequently fuzzy. They may not mark the low or high. So I suspected there are other price points of importance. I have found a way to calculate prices that are "MoonTide hot." These frequently do mark the low, high, or close of the day. My research hunch is that the pivot system prices are driven by the Sun, while my hot prices are driven by the moon. All that is fine, but how can they be used in trading? Let's take a simple example, just using the MoonTide turns and the pivot prices. This chart is an ESignal chart, annotated with vertical lines marking the MoonTide turns, and the pivot prices. The times on the chart are Mountain, 2 hours earlier than the Eastern times shown on the automatic charts on this site. This is a 3 minute bar chart, with a 20 bar Bollinger band, and two moving averages in yellow and blue. These are the yellow 21 minute 7 bar average of the 3 minute closes (close to the 20 minute EXMA), and the blue 108 minute 36 bar average of the 3 minute closes (close to the 110 EXMA).
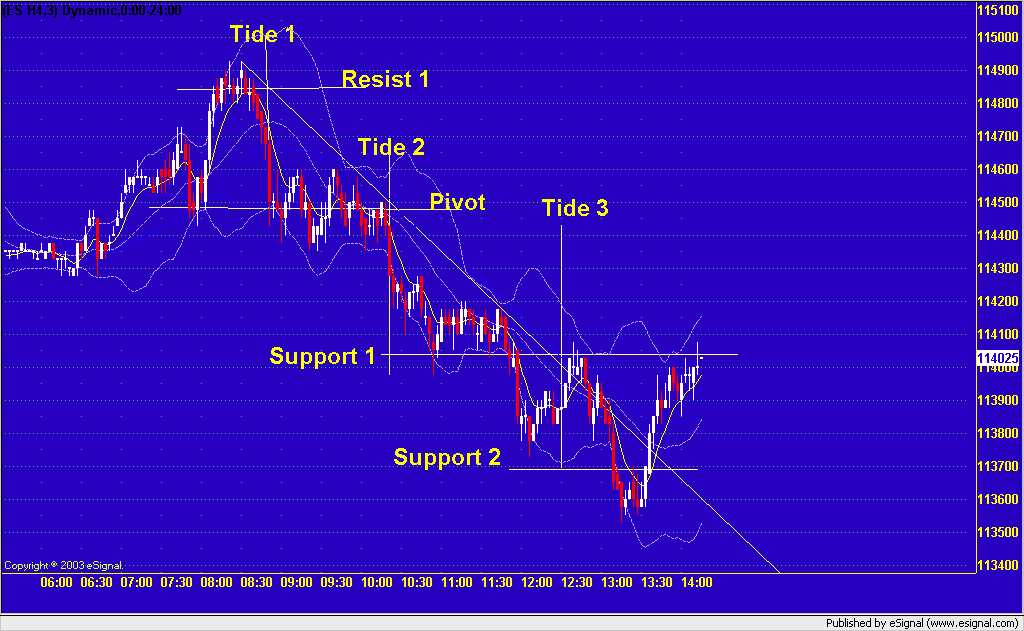
Prices paused at the Pivot, and there gave a 20/110 continuation buy, before heading higher to
the next pivot price at R1 - resistance 1. They congested under R1, and the Bollinger bands
pinched going into MoonTide turn T2. This was another good trade setup, giving a continuation
buy signal on the 20/110 EXMA, followed by a Bollinger band breakout. This was another
good buy point. Note that on such a buy, the stop can be placed at the lower Bollinger
band, which is often closer than the normal stop used in our standing instructions.
This rally continued up to the R2/R3 pivot prices, and peaked near the MoonTide turn
T3. The huge wick on the top candlestick signaled the rally was over. Also, it was
the 7th move up from the low, making a nice 7 move Chaos Clamshell.
This example shows how the Tide turns and the pivot prices can be used together to find
good trades. Now here is another example in the other direction.
The final low came after the continuation sell at Tide 3, this time reaching S2. At that point
the 7 moves in a down Chaos Clamshell were complete. Notice that the 20/110 EXMA gave a
sell early, then continuation sells near each Tide turn/pivot price level, and
did not recross until after the low at support 2.
Now, not all of these prices were exact. So one must ask if there are other prices
that matter as well. My answer is that there are- the "MoonTide hot" prices.
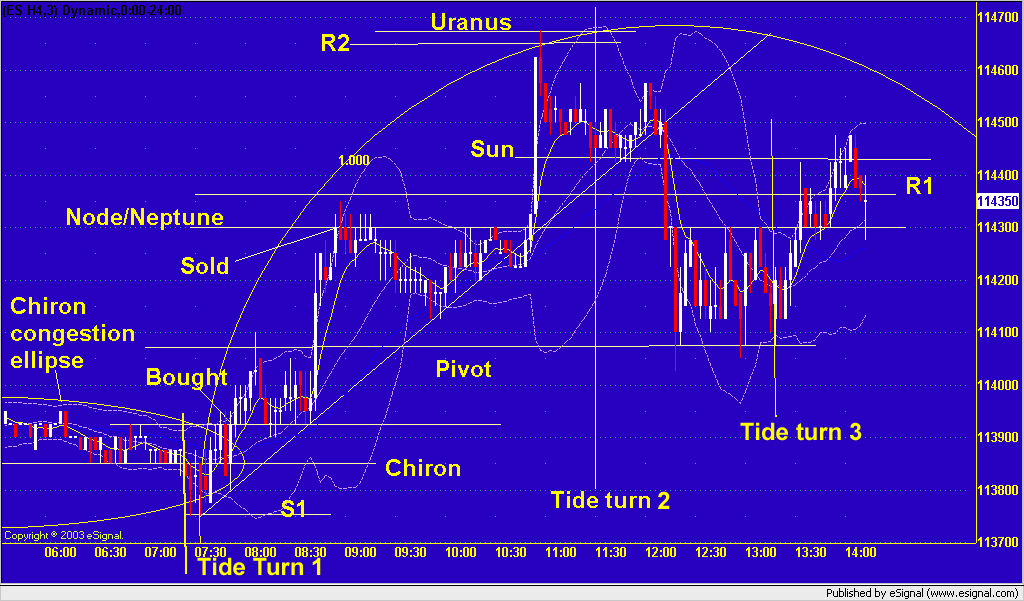
This chart shows an example.
When the market exploded upward, I did not wait for it to reach R1. I covered at the
Neptune/Node price of 1143. I knew from my research that this was the physical
planetary price near R1, and that R1 might not be reached until latter in the day.
Prices were held down by this price until about 10:40 (12:40 eastern ) when they
exploded up-on a continuation buy on the 20/110 and a Bollinger band breakout.
What happened next was a "hook and go" on the 20/110 EXMA's. Coming out of Tide turn 2,
prices rallied, giving an apparent continuation buy. But this collapsed quickly,
giving a 20/110 sell and Bollinger band sell breakout. Fortunately, I was able to reverse
for a small loss and go short. But I made almost on the short. The move just
died at the third Tide turn.
Here a most interesting thing happened. Prices chopped between the pivot price,
and the Node/Neptune price. After Tide turn 3, prices were finally able to
rally above the pivot price up to R1.
So it was very clear on this day, that the pivot prices and planetary prices were both at play.
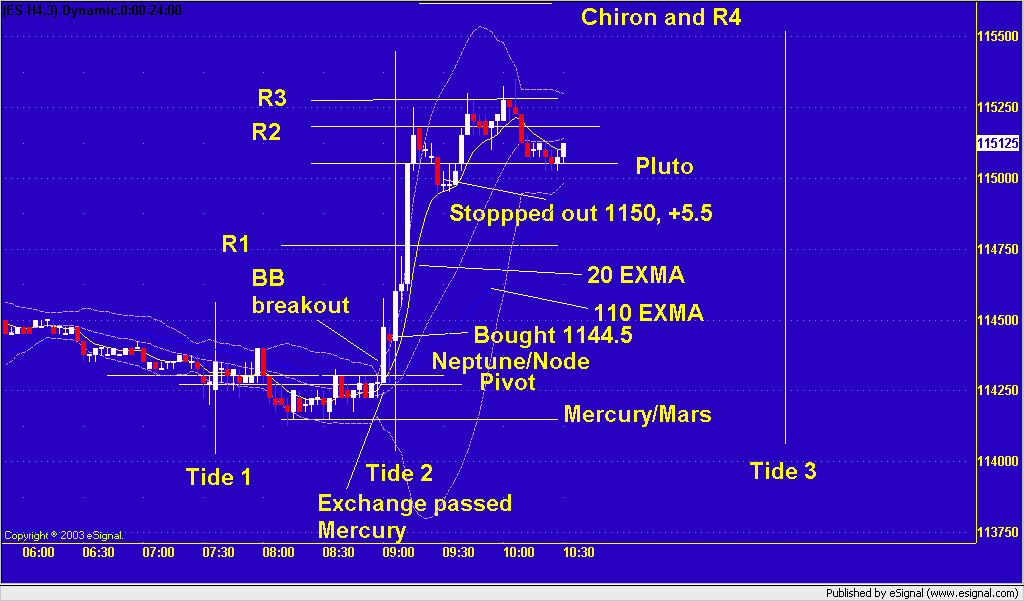
Now let us look at today. This chart shows the start of the day.
Going into the second Tide 2 time, as the Exchange passed Mercury, prices broke upward, giving a
20/110 buy and a Bollinger band breakout. This was a fast break EXACTLY as the Exchange passed
Mercury. I bought 1144.5, and was stopped out on a trailing stop at 1150.
Prices had made it to the R1 price level, then up to the R2 level. But the lower price of the
congestion was set by Pluto. Given the nature of the day (Alan Greenspan was speaking) and
the support on Pluto, I suspected that another move to the R4 / Chiron level was
coming. Since the prior day's low was near Chiron, R4 had captured that information,
and an 18 point move from Chiron to Chiron was probable.
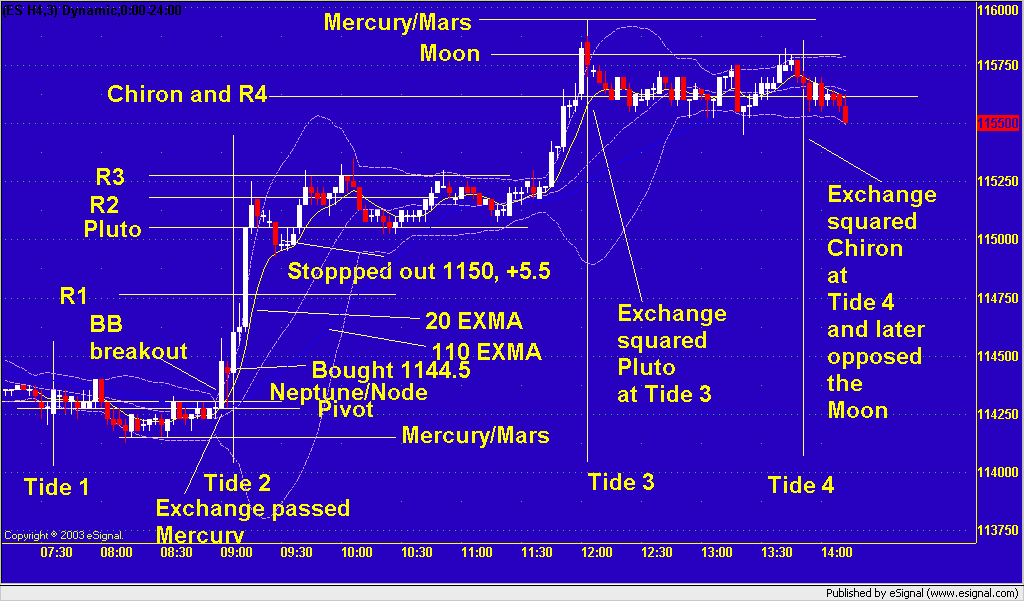
This chart shows what happened later in the day.
Prices then congested sideways, stuck on R4/Chiron. They peaked on Tide 4 in time, as
the Exchange squared Chiron. The peak was on The Moon price.
Note that on this high, the was not Bollinger band breakout, but a band edge repel.
After that, prices declined to the lower Bollinger band.
Now, note that to a close approximation, the low was set by Mercury and Mars, the high by the Moon,
and the close by Chiron. So one way to think about tomorrow's pivot calculations is that
they ARE planetary calculations using Mercury, Mars, Moon, and Chiron prices. Just as W. D. Gann averaged certain planets, the pivot
calculations often do as well. They just use a different selection method.
Hopefully, this page will give you another way of trading the MoonTides. If you simply
take the MoonTide turns and mark vertical lines on a chart,
then add the pivot prices
and the "MoonTide hot" prices as horizontal lines, you should be able to find some very good trades.
The people who use intuition the most are the pit traders - since they stand in a crowd they can feel
the energy flow of the crowd, and they just go with it.
But even when they do that, they are subject to the natural energy cycles of the market. I have studied these
very closely, and have had success isolating two cycles that show up every day. One I track with a
20 minute exponential moving average on the closes of the 1 minute bars (7 bars on 3 minute chart), and the other I track with a 110 minute
EXMA (36 bars on a 3 minute chart). The 110 shows you the trend, and the 20 shows you the swings. Just watching these alone can tell you
much about the trend of the market. The 110 is related to the Moon, and the 20 is related to the rotating earth.
It is pretty obvious that we are all effected by the rotating earth. When the sun is up, our brains work. We are bright,
social, and gregarious. When it goes down,
it slows down and we become sleeping zombies. Similarly, we are all effected by the Moon. At full moon,
as the Moon reflects a larger number of negative ions back into our atmosphere, we get romantic, happy, and
giddy. At new moon, when the Moon interrupts the flow of ions from the Sun, we feel nervous, restless, and depressed.
My MoonTide calculations try to capture the net effect of these natural cycles on the S&P market. It is not
a perfect system, being limited by my knowledge of the system, my ability to program it, and the general complexity
of it. But if you take a simplified view of it, watch the natural cycles, and trade it carefully, it works over time.
|
 The first Tide turn after the outcry open is marked T1. Prices made a low near the S1 support 1
price, then gave a 20/110 buy signal. They also broke through the top of the Bollinger band
channel. At that point, a buy was a good bet.
The first Tide turn after the outcry open is marked T1. Prices made a low near the S1 support 1
price, then gave a 20/110 buy signal. They also broke through the top of the Bollinger band
channel. At that point, a buy was a good bet.
 On this day, one of the MoonTide hot prices was Chiron at 1038.5. Just below it was S1 at
1137.6. Early in the day, I identified a horizontal congestion ellipse due to Chiron.
As it ended, prices dipped to S1, then rallied above Chiron. This gave both a 20/110 buy
signal and a Bollinger band breakout. I bought 1139.25.
On this day, one of the MoonTide hot prices was Chiron at 1038.5. Just below it was S1 at
1137.6. Early in the day, I identified a horizontal congestion ellipse due to Chiron.
As it ended, prices dipped to S1, then rallied above Chiron. This gave both a 20/110 buy
signal and a Bollinger band breakout. I bought 1139.25.
 The first Tide turn was on the open. Prices dropped below the pivot, and gave a 20/110 sell signal.
But this was a marginal short, which I covered quickly. I resold, but was stopped out.
Prices just would not go down.
What was holding them up? 1141.50 was a "MoonTide hot" price due to Mercury and Mars.
The first Tide turn was on the open. Prices dropped below the pivot, and gave a 20/110 sell signal.
But this was a marginal short, which I covered quickly. I resold, but was stopped out.
Prices just would not go down.
What was holding them up? 1141.50 was a "MoonTide hot" price due to Mercury and Mars.
 Prices broke higher going into Tide 3. Note the 20/110 continuation signal and the
Bollinger band breakout, coming off the congestion based on Pluto.
They broke above R4, which was also Chiron, and peaked EXACTLY on Tide 3 in time (email had a typo).
The price of the high was halfway between the Moon price, and Mercury, and Mars.
Prices broke higher going into Tide 3. Note the 20/110 continuation signal and the
Bollinger band breakout, coming off the congestion based on Pluto.
They broke above R4, which was also Chiron, and peaked EXACTLY on Tide 3 in time (email had a typo).
The price of the high was halfway between the Moon price, and Mercury, and Mars.
