Trading Band Update
a division of MoneyTide.com|
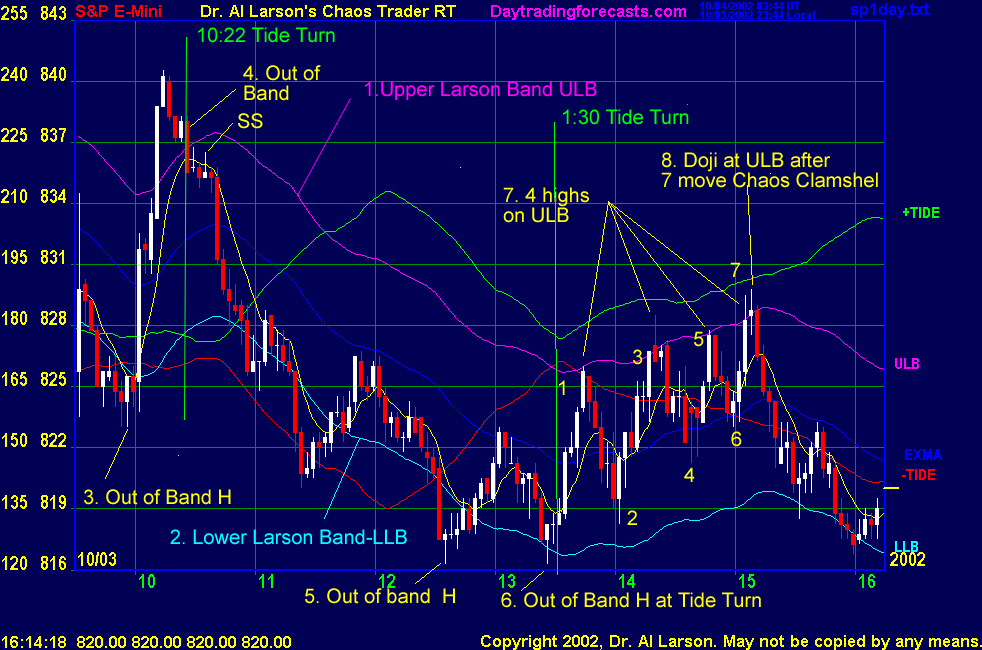
October 3rd, 2002 As fine as our track record has been, there is always room for improvement. Over the past few weeks I have been engaged in a dialog with long-time client MM (over 10 years!), who has used my MoonTide turn times along with candle stick patterns and Bollinger bands to find some very good trades. After studying his approach, I have adopted a modified form, to be used in addition to the current technique. My modification is to use Larson Bands, rather than Bollinger bands. Larson Bands, in this case, are the 110 minute EXMA tracking indicator, plus and minus 4.5 points. I have found that this range bounds most of the price movement of the S&P intraday. Unlike Bollinger bands, they do not contract sharply in a trending market. And, they are easier to compute. The normal entry technique used with the 20/110 EXMA system is to wait for them to pinch together or cross near a MoonTide turn, then go with the flow. This is basically a trend following technique, and has produced very good results. Markets also trade in ranges, and one can try to sell the high of the range, and buy the low of the range. So knowing that prices are high or low compared to the normal range is useful. In addition, one needs an indication that prices will turn back into the trading range. Here is where 3 minute candlesticks come in. If prices are struggling to continue moving, a candle with a long wick and short body will form, or one with no body at all. The latter is called a Doji. A top is shown by a Shooting Star (SS) which has a top wick and short body. A bottom is shown with a Hammer (H), a lower wick with a short body on top. These are most useful if they coincide with MoonTide turns. This chart shows today, which had Tide turns near 10:22 and 1:30. Read the annotations on the chart to see how the band edge+candle pattern + Tide turn would have helped today.
The 10:22 came a few minutes early, and was a strong return to the band. The return even expanded the band lower-right up to the 1:30 Tide turn time. There was a nice hammer at the LLB and the 1:30 Tide Turn, followed by a move not only to the 110 EXMA, but to the Upper Larson Band (ULB). These clearly would have been good trades on the MoonTide turns. In neither case did the 20/110 EXMA's work well. That is because this was not a trending market. This was very obvious in the afternoon rally. It had large pullbacks, and the slope of the band was shallow-which was forecast by the slope of the MoonTides. Prices kept rallying to the ULB. Then at 3:09, another good trade setup occurred. This was a MoonTide inversion, so Tides did not help. But this was also a Natural Time, at 3:09 exactly, and was the seventh move in the up Chaos Clamshell from the low. So it too was a good trade setup. I have documented this technique because I will add it as an additional technique to trade the MoonTide turns. It does not replace, but complements, the trend following technique already proven. Hotline instructions will give details to help you recognize and use this technique. Thank you MM, for sharing your insights, and for ten year of faithful support. By the way, MM took 15 points out of the 10:22 Tide turn. Well done. [ Home ] [ List of Charts ] [ Chaos Clinic ] [ Aspects ] [ Aux ] [ Alert ] [ Chat ] |